I turn messy spreadsheets into live dashboards people actually open every morning.
I design and build interactive tracking systems - dashboards, project trackers, client portals - for teams who are done copy-pasting numbers into slide decks.
This file, on the left, becomes this, on the right. Drag the handle and see for yourself.
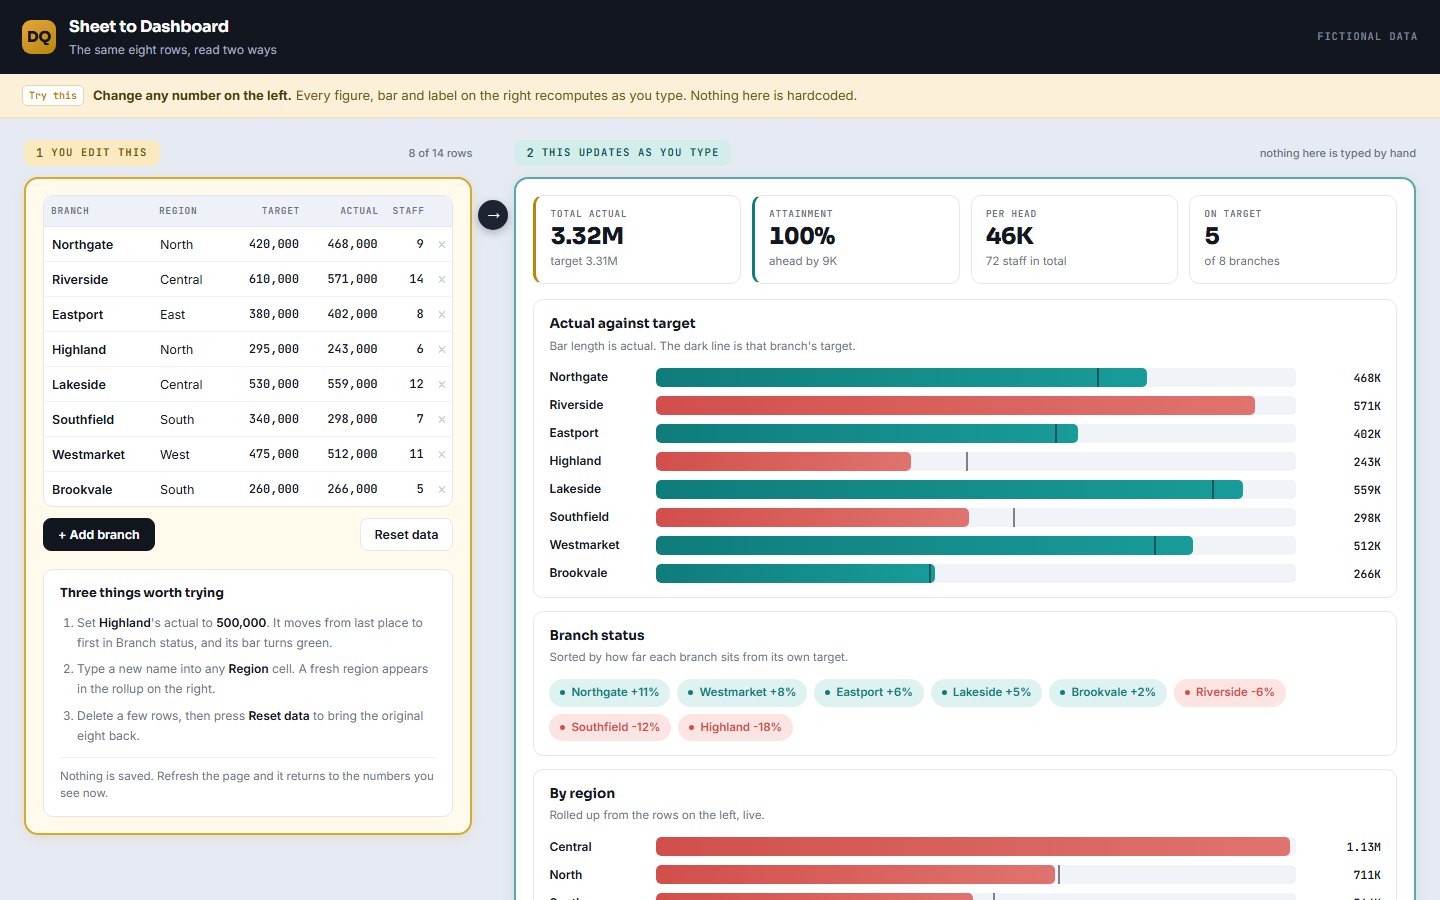
| A | B | C | D | E | F | G | H | I | J | K | |
|---|---|---|---|---|---|---|---|---|---|---|---|
| 1 | PROJECT STATUS TRACKER - UPDATED WEEKLY - DO NOT DELETE ROWS | ||||||||||
| 2 | last updated by: ops team (ask Layla before editing!!) | ||||||||||
| 4 | # | Project | Owner | Dept | status | Status | % | Start | due date | Notes / comments | RAG |
| 5 | 1 | Website redesign | Layla | Marketing | In progress | WIP | 60% | 01/03/2026 | 15/06/2026 | waiting on legal | Amber |
| 6 | 2 | website redesign | layla k. | mktg | in progress | 0.6 | 1-Mar-26 | 15/6/26 | DUPLICATE?? check | amber | |
| 7 | 3 | CRM migration | Bilal | IT | Blocked | BLOCKED | 35% | 12/02/2026 | 30/05/2026 | vendor not responding since 4 weeks | Red |
| 8 | 4 | Q2 hiring plan | HR | done | Complete | 100% | 05/01/2026 | 28/02/2026 | Green | ||
| 9 | 5 | Warehouse automation | Maya | Ops | In Progress | on track | 45 | 20/02/2026 | TBD | phase 2 depends on budget | green |
| 10 | |||||||||||
| 11 | 6 | Vendor onboarding | Omar | Procurement | not started | 0% | ? | Q3 | see email from 12 Jan | ||
| 12 | 7 | Compliance audit prep | Sara / Bilal | Legal | In progress | WIP | 80% | 10/01/2026 | 01/04/2026 | OVERDUE | Red |
| 13 | 9 | Training program | Layla | HR | In progress | WIP | 70% | 01/02/2026 | 30/06/2026 | Green | |
| 14 | 10 | Intranet refresh | layla | IT / Comms | on hold | paused | 18% | 15/01/2026 | end of May | budget frozen, revisit | Amber |
| 15 | 11 | Fleet renewal | Maya | Ops | In progress | 10 | 03/02/2026 | 30/09/2026 | stalled since week 3 | ||
| 16 | TOTAL | 48.6% | avg, excludes blanks? | ||||||||
Design your own dashboard.
Your logo, your colors, your own Excel file. Download the result and keep it.
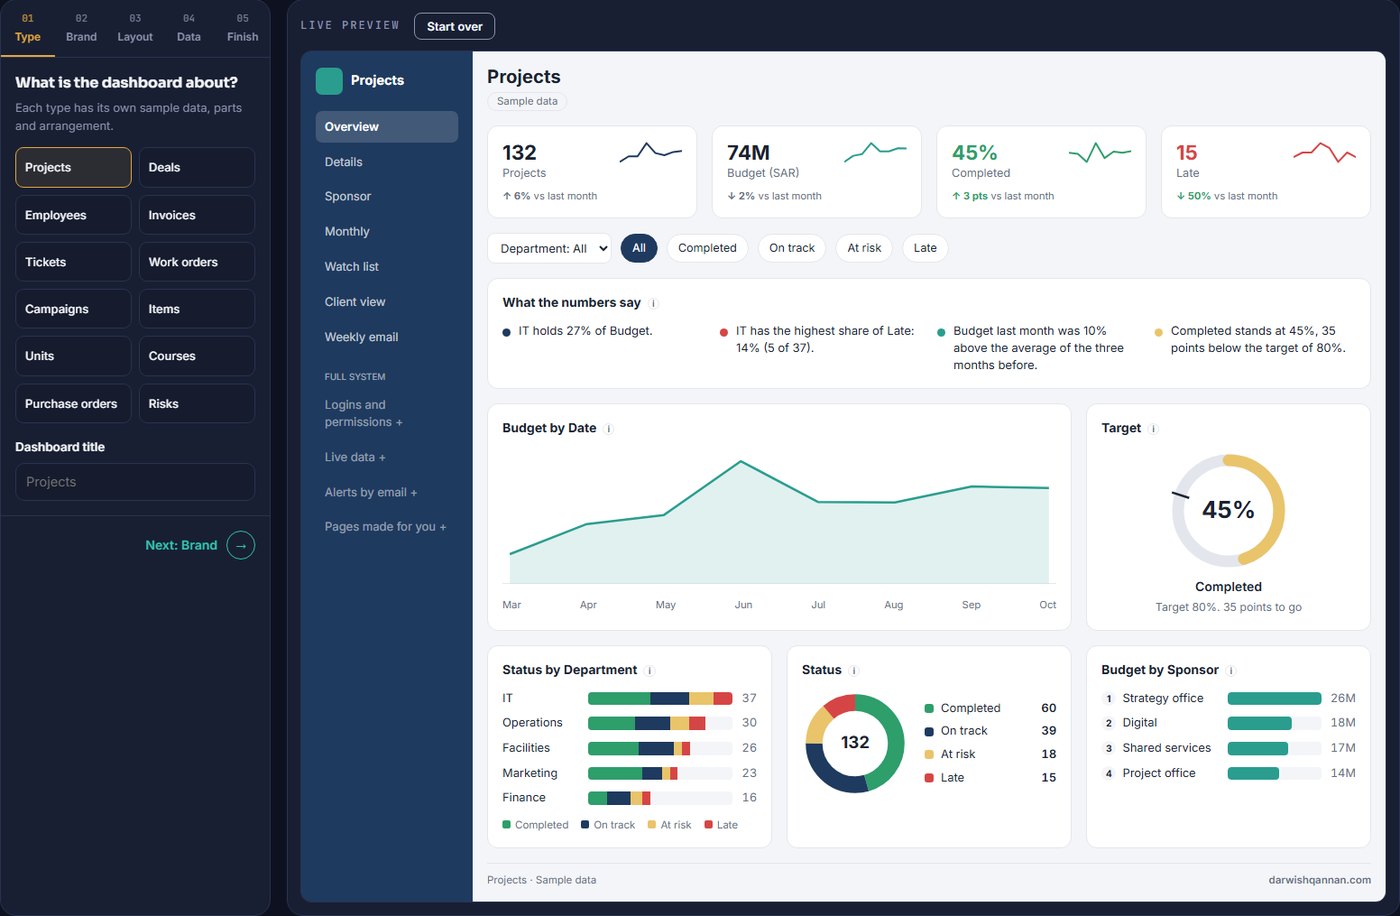
Four systems, running right here.
Pick one and click inside it.Pick one, then open it full size to try it. Companies, people and numbers are fictional, and no real client or dataset appears anywhere.
Do not take my word for it. Bring your spreadsheet.
Three things I find in almost every tracker that lands in my inbox. See whether yours has them: both tools below run inside your browser, and nothing is uploaded.
60% · 0.6 · 45One column, three ways to write itProgress typed as a percentage, a fraction and a bare number in the same column, so no total can be trusted.
status · Status · RAGThree status columns, no shared definitionEach filled by a different person, and they disagree on the row that matters most.
TBD · Q3 · ?Dates that are not datesSo nobody can say what is late until someone reads every row by hand.
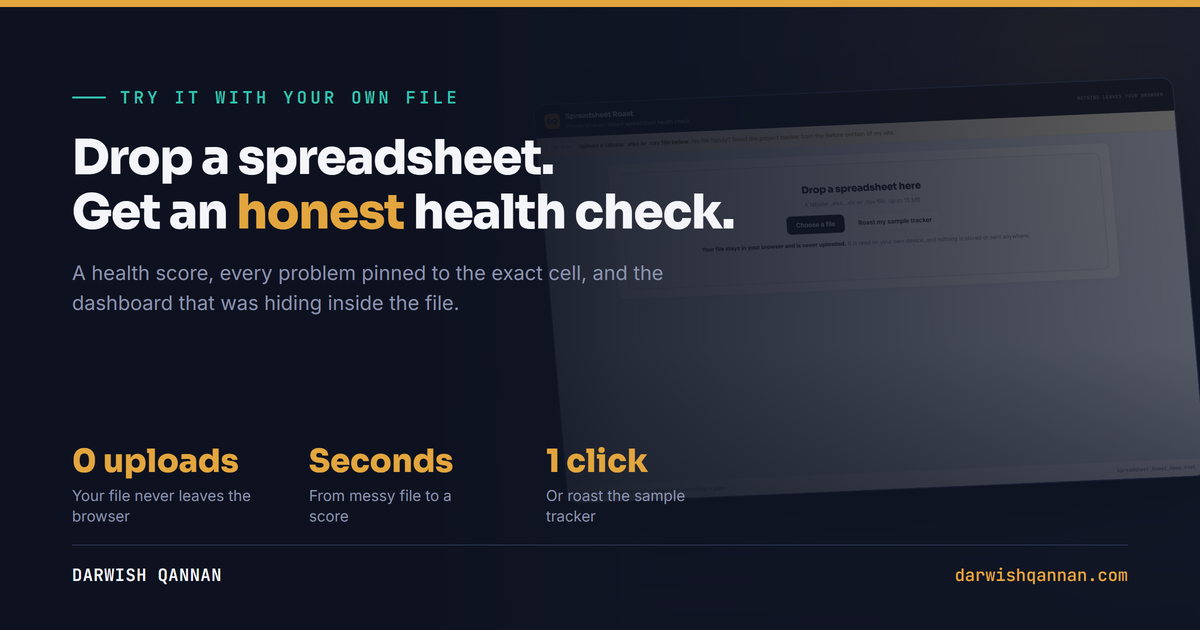
See how healthy your spreadsheet really is
A health score, every problem pinned to the exact cell, and the dashboard that was hiding inside it.
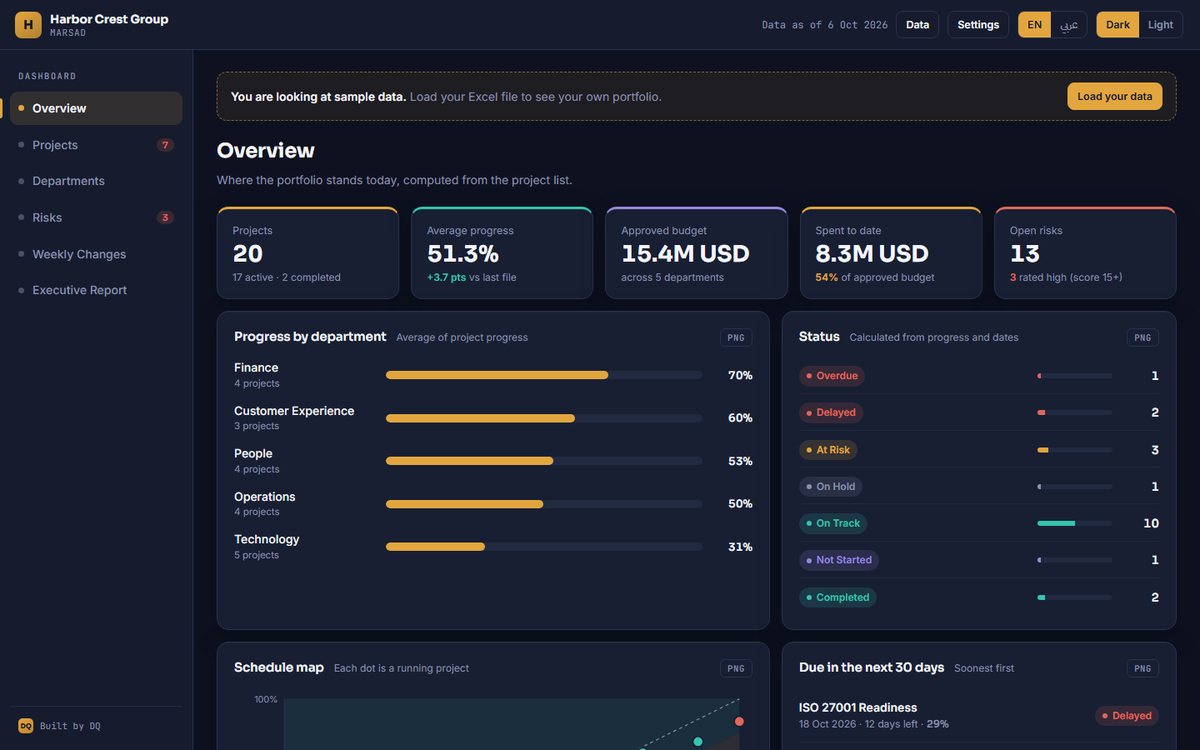
Drop a project list, get six pages back
Status worked out from progress and dates, departments, risks, what changed since last week, and a written report. English and Arabic.
Four more, each one a click away.
A game, a check, a live system and a comparison. More in the Lab
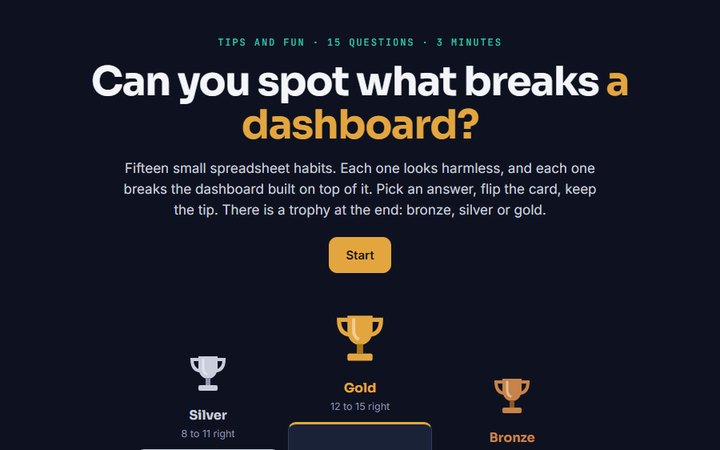 Spreadsheet Trophy
Fifteen quick questions about the habits that break a dashboard. Win a trophy.
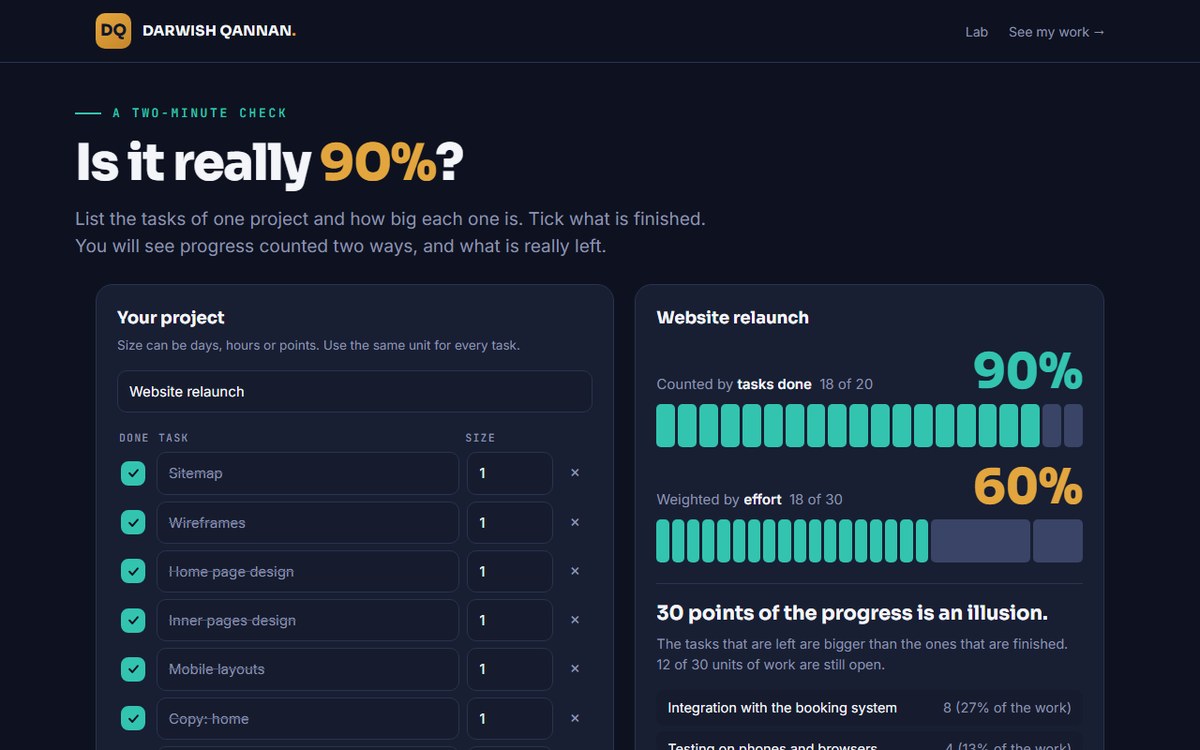 Is it really 90%?
Progress counted two ways, and what is really left.
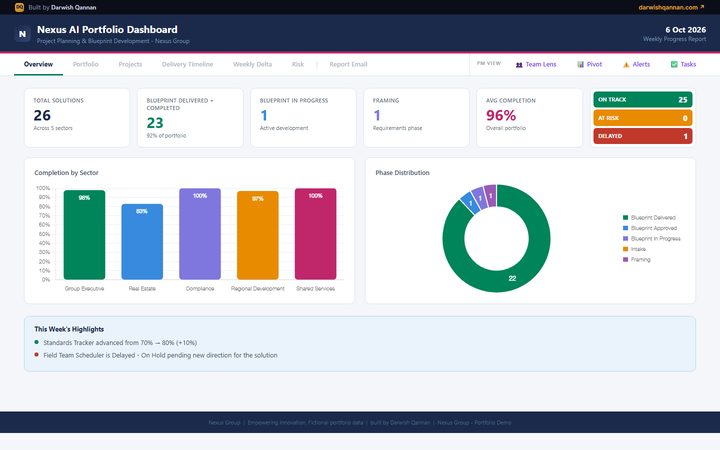 AI Solutions Portfolio
AI use cases from discovery to handover, and the story behind the dashboard.
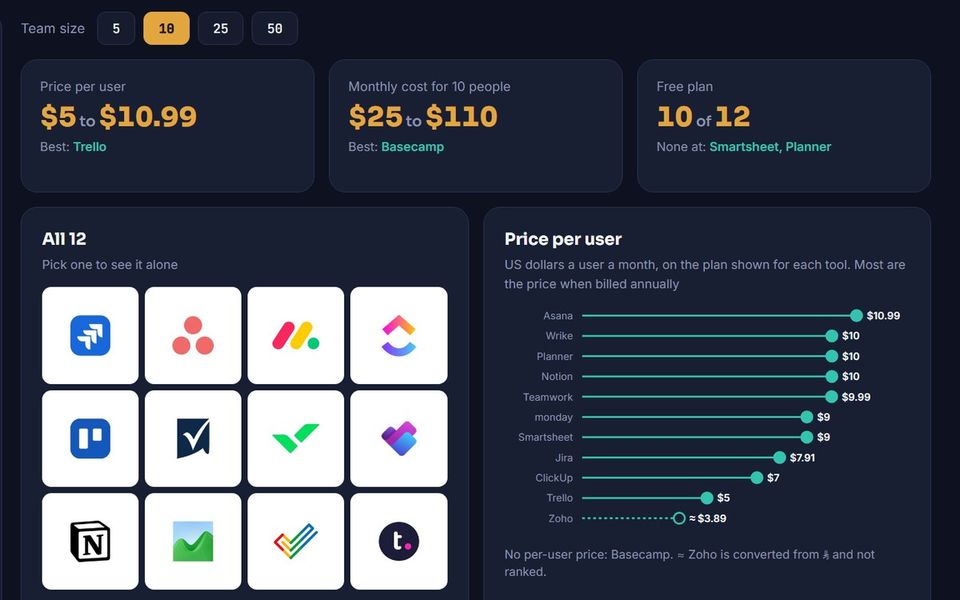 12 project tools, compared
The price, what a team your size pays, and which plan has each feature.
The AI Solutions Portfolio has a story behind it: a full day of copy-paste that became a report in minutes.

I build dashboards, client portals and AI-assisted internal tools, with a background spanning fintech, insurance, and AI consulting for government entities.
Before that I spent three years at Hala, a fintech company: first supervising a 30-person national sales team, then as its Data & Team Performance Analyst, building the reports on team KPIs, merchant behavior and market trends that went to senior management.
Everything on this site is my own independent work, built with fictional data.
What is actually being tracked today, and where it breaks down.
Layout and structure chosen for this dataset, not a recycled template.
Real filters, real tabs, real interactivity from day one.
One self-contained file you own outright, plus a short walkthrough.
"...his ability to understand the business behind the numbers."Fatimah Bafayyadh CVM Manager at Geidea · worked with me at HalaRead the full recommendation
I had the pleasure of working closely with Dr. Darwish Qannan at Hala.
What stood out to me was his ability to understand the business behind the numbers. He brought together data on merchant behavior, market trends, and team performance, then presented it clearly so we could see where to focus and what to improve.
Darwish is thoughtful, dependable, and strong in his field. I enjoyed working with him and would gladly recommend him to any team looking for someone who can turn data into practical insight.
"...brought the numbers together and made them clear and easy to act on."Ahmed Assiri Senior Business Development Regional Manager · HalaRead the full recommendation
I worked closely with Darwish at Hala while I was leading business development for the Western region. We worked together on the business development team reports and on the main report for senior management. Darwish was the one who brought the numbers together and made them clear and easy to act on. He is organized, reliable, and great to work with. I would gladly recommend him to any team.
Have a spreadsheet that should be a dashboard?
Tell me what you're tracking today and how. I'll tell you honestly whether a system like this would help - and what it would take to build.